A Venn diagram is the pictorial representation of a logical relationship within two or more concepts. Usually intersecting and non-intersecting circles are used to indicate the relationship between the sets. A Venn diagram is widely used in set theory, business, mathematics, logic, statistics, and computer science. For a better understanding of the notion of the venn diagram, let’s go through the given post.
What is a Venn diagram in Mathematics?
Contents
A Brief Guide to Venn Diagram
Venn diagrams are the logical diagrams or set diagrams used to visually represent the differences and similarities between different sets. In other words, these diagrams in a pictorial way represent the sets, relation between the different sets, and operations performed on these sets such as the union of sets, the intersection of sets, and differences of sets. A Venn diagram helps a student to visualize the logical relationship between different sets and their elements so that they can easily solve the questions based on these sets.
Symbols Used to Represent Operations of Set:
Union of set symbols: A B; representing A union B
The intersection of set symbols: A ∩ B; representing A intersects B
Complement of set: A’ or Ac
Operations Performed on a Set:
Union of Set: The union of two sets say set A and set B is represented as,
A B = {x | x ∈A or x ∈B}
This operation is represented on set A and set B by using a Venn diagram having two circles. And the total area of both circles combined indicates the union of both set A and set B.
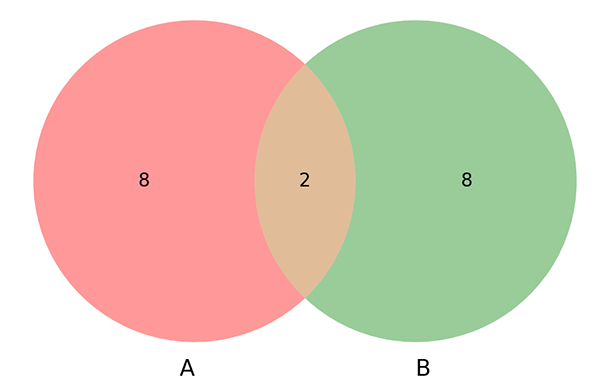
The Intersection of Set: The intersection of two sets, say set A and set B is represented as,
A ∩ B = {x : x ∈ A and x ∈ B}
This operation is represented on set A and set B by using a Venn diagram having two intersecting circles. And the area common to both circles indicates the intersection of both set A and set B.
Complement of Set: The complement of a set, say set A is represented as,
A’
Those elements are represented that are not present in set A by using a Venn diagram having a circle. And the total area not covered by set A indicates the complement of set A.
Difference of Set: The difference of two sets, say set A and set B is represented as,
A – B
This operation is represented on set A and set B by using a Venn diagram having two circles. And the difference between set A and set B is calculated by excluding the area which is common to set B from the area covered by set A.
Cuemath is an online teaching platform that offers a Math program at an affordable price. You can understand the basics of the Venn diagram from the best teachers applying the right teaching methodologies and approaches. Just visit Cuemath website and overcome the difficulties you might be facing because of traditional blackboard learning.


More Stories
cuny chalkboard baruch login
A Guide to Software Development Life Cycle & its Process
UPSC 2022 Exam Date Calendar